The Medieval Warm Period (MWP) is defined the time as between AD 950 to 1250 where evidence shows that some parts of the planet were warmer than average.
Nova claims that her friends at the denialist, Exxon funded website CO2Science have demonstrated that the MWP was globally warmer in the past, without CO2.
- Firstly, SO WHAT? We know it was certainly warmer sometime in the past. What matters today is that we are causing it, at a very rapid rate and the science says we are going to heat up well beyond what the MWP might have been.
- Secondly, if were warmer n the MWP than today, then this is evidence for a high sensitivity value, something climate denialists don’t want.
- Thirdly, CO2Science don’t perform science, they draw their own conclusions from other peoples science. The Co2Science analysis is not peer-reviewed, contains some serious flaws and it would appear they deliberately aim to deceive their readers.
CO2Science’s Flawed Method
CO2Science claim their analysis is legitimate because they use peer-reviewed science – let’s be clear about this. The papers listed in their analysis are peer-reviewed however CO2Science’s own analysis and conclusion are NOT peer-reviewed; they can and do make many mistakes.
CO2Science categorise the different papers by counting how many have any warming during the MWP period, but this logic is flawed and here’s a very simple diagram to explain why.
CO2Science is not concerned with how much warming occurred Globally during the entire MWP, so long as some warming occurred during some part near 950 AD and 1250 AD, then they are happy to include that as a +1 for MWP evidence, even if the majority of the temperature indicates a colder MWP. In the above graph I’ve plotted two theoretical samples, both not very warm in themselves, however using CO2Science’s method of classification, each has some warming in it, therefore, according to CO2Science, they both counted as evidence that the MWP was warmer than the CWP, when, if you look at the “Global” picture at any given time, the average temperature is well below the CWP.
The above image uses just two samples, a more realistic picture using many samples would appear something like this …
CO2Science will pick out each individual sample and say that because it exceeds the CWP at some point in time, it is therefore proof that the MWP was warmer. Only by combining each of the individual samples together do we actually get a GLOBAL picture at any time.
Proper analysis by climate scientist will consider the entire period, and in effect, overlay each of the samples to arrive at a fuzzy picture of what the temperature might have been like. This is what is shown in the IPCC report.
The picture below is an ensemble of reconstructions from a number of climate scientists, all showing roughly the same conclusion; a slightly warmer MWP, then the LIA, followed by dramatic warming.
 (source)
Moving the MWP
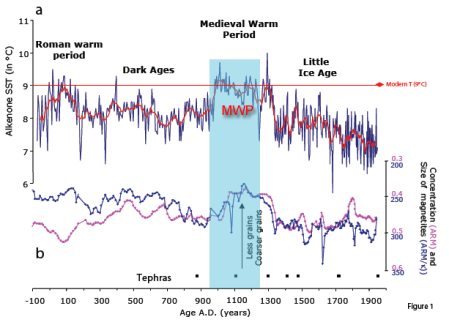
As mentioned before, the MWP is defined the time as between AD 950 to 1250 however CO2Science label this incorrectly in many of the graphs in order to fool you into believing the MWP is the higher section of the graph.
Africa
In Africa CO2Science list two studies from the same cave in Makapansgat Valley and although the graphs both show some warming around the MWP, they occur at different times. This is a reminder of how “approximate” these indicators are. Temperatures from proxy data, such as stalagmite are only a very rough indicator of local temperatures at best. I’ve highlighted the actual MWP (950-1250 AD) in each graph to clearly highlight the difference between them. Note how CO2Science deceptively move the label for MWP to hover over the higher peak. In the first graph they move it backwards in time, in the second graph the move it forward.
CO2Science don’t provide a graph for their Continental Margin Off Southern Mauritania study, just their own clam “.. the Medieval Warm Period, the peak 50-year mean SST of which was 1.1°C greater than the corresponding 50-year mean SST at the end of the record”. The paper however did contain the following two graphs, the first showing a steady decline in temps, albeit with great variability. The second, more detailed graph, shows a rise in Sea Surface Temperatures over the last century.
Co2Science’s analysis of Lake Tanganyika certainly doesn’t support a MWP in that area. CO2Science chose to include the following words from the study.
This work revealed the existence of “a period of extended warmth between AD 1100 and 1400,” which clearly represents the Medieval Warm Period. And the peak LST of this period was 1.4°C cooler than the peak LST at the end of the 20th century.
I wonder if their readers paid attention to the paper’s title “Late-twentieth-century warming in Lake Tanganyika unprecedented since AD 500“. The paper’s introduction …
Our records indicate that changes in the temperature of Lake Tanganyika in the past few decades exceed previous natural variability. We conclude that these unprecedented temperatures and a corresponding decrease in productivity can be attributed to anthropogenic global warming, with potentially important implications for the Lake Tanganyika fishery.
Antarctica
CO2Science present no direct measurements of the MWP in Antarctica; instead they draw their own conclusions from the papers they list.
CO2Science claim that the MWP must have been warmer because there is evidence that the ice was further melted than present conditions. Their mistake is to compare the ice extent of the MWP, which might be the result of many hundreds of years of “warmer than normal”, against present conditions. They either don’t realise (or are too stupid to) that the current melt is just the beginning of the CWP. Even if temperature were to remain constant in the CWP, the melting would continue for many hundreds of years which could result in more melting than in previous warmer periods.
The scientists that have produced the papers (here and here) do not postulate on whether the previous warming was greater than today or not because you simply cannot tell from the data gathered. CO2Science take liberty and a leap of logic to reach their biased conclusions. Either they are unaware of their mistake, or they are purposely trying to deceive the reader. Either way the lesson learnt is to read the original paper rather than the blogger’s own interpretation of the paper.
In the study of the Eastern Bransfield Basin CO2Science have drawn their own conclusion instead of presenting the original author’s findings. They strangely present a graph of “magnetic susceptibility” rather than temperature. The original authors make no comments as to whether or not the MWP was warmer than today, but this doesn’t deter CO2Science.
Looking at the paper An ikaite record of late Holocene climate at the Antarctic Peninsula, CO2Science again jump to their own conclusion. The original authors state “This ikaite record qualitatively supports that both the Medieval Warm Period and Little Ice Age extended to the Antarctic Peninsula.”, but say nothing about the comparison to the CWP.
Asia
Under a Big Chunk of Eastern China, CO2Science once again play the “It was hotter sometimes” argument. It bears repeating, we are experiencing a large sustained GLOBAL warming, not a temporary decadal fluctuation as might have been experience in some parts of China, for some periods of time.
Aside from that, it’s ironic to see Co2Science embrace a paper that also confirms the current warming. The paper states …
Temperature has been rising rapidly during the twentieth century, especially for the period 1981–99, and the mean temperature is now 0.5°C higher than for 1951–80.
In Japan, CO2Science highlights the warmer peak, and forgets to mention that the paper says that from the tenth century, “Temperatures then fell until the 1180s“.
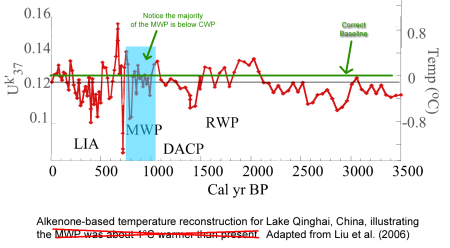
In Lake Qinghai, CO2Science again deceptively depict the warming. Below is the graph they have, but I have redrawn the zero baseline used in the paper. The original authors do not support a warmer MWP than today.
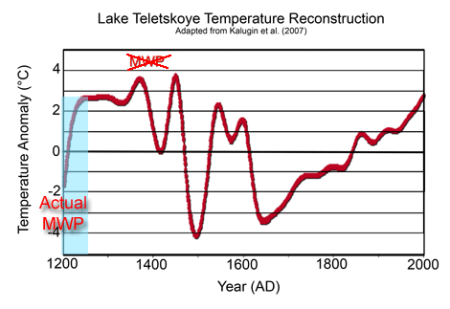
In Lake Teletskoye, CO2Science wish to move the MWP several hundred years into the future. The actual data shows that most of it was colder than today for this region.
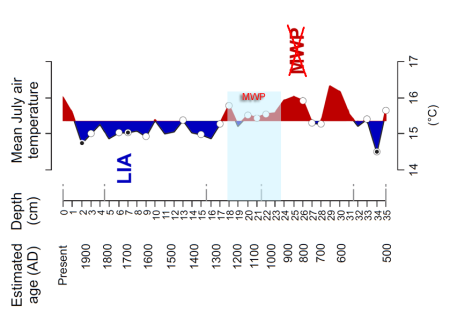
 In Mid-Eastern Tibetan Plateau, CO2Science claim the MWP was warmer, although they moved it earlier to between 875 and 980AD. Looking at the graph in the paper tells a very different story with the majority of the MWP well below current temps.
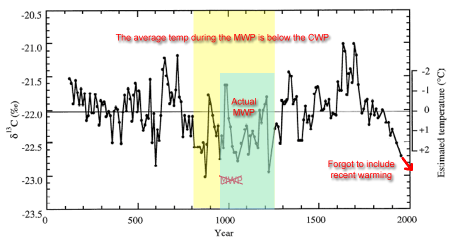
In Yakushima Island, Japan CO2Science move the MWP slightly back in time to include a larger peak. They forgot to include recent warming on this graph and they also fail to notice that the average temp for the MWP was well below the CWP.
Australia / New Zealand
With NZ data, CO2Science move the MWP label forward in time to highlight the highest part of the graph. They also neglect to show the recent warming since 1900.
Europe
In Central Scandinavian Mountains, Sweden, CO2Science want to highlight just one small peak, ignore the deep depression next to it, and don’t realise the majority of the MWP was cooler than the CWP. And of course CO2Science also draw their own conclusions which differ from that of the original authors.
In Lake Pieni-Kauro, Finland, CO2Science move the MWP back in time and again draw their own conclusions different to the original authors.
In Lake Redon, Spain, CO2Science again move the MWP backwards.
 In Northern Fennoscandia CO2Science adds their own “Current Temperature Line” to the original graph and once again draw their own conclusions. The original paper does not agree with CO2Science, in fact they state quite clearly …
No consistent temperature peak is observed during the ‘Medieval Warm Period’.
In the Northern Icelandic Coast CO2Science slightly expands the MWP into the future to cover another peak and tells us that “the peak warmth of the Medieval Warm Period was about 1°C higher than the peak warmth of the Current Warm Period”. They fail to inform their readers that the lowest part of the MWP was almost 2° C COLDER and that on average, the MWP is below the CWP.
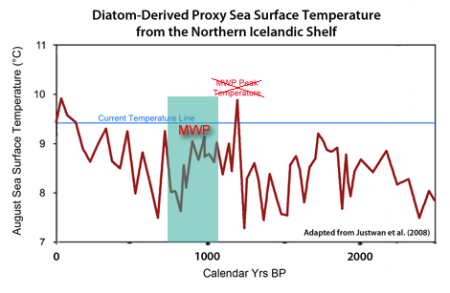
In the Northern Icelandic Shelf CO2Science move the MWP to be earlier in time in order to be over the higher part of the data. The “Current Temperature Line” has been added by CO2Science and as usual, the original paper does not agree with CO2Science’s conclusion.
North America
In the Columbia Icefield, Canada CO2Science pick only the small peaks to highlight the MWP and ignore the fact that for the majority of the time the temps were much cooler than the CWP.
In Crête, Central Greenland CO2Science move the MWP to an earlier time and want you to know that “that peak Medieval Warmth was about 0.6°C greater than it is presently”. They avoid labelling correctly and avoid telling you the cooler part was more than a degree colder than the CWP.
In Donard Lake, Canada, CO2Science wish to only highlight the peak and again ignore the lower temps of the MWP. They have also drawn their own conclusions which are not shared in the original paper.
In the GISP2 Ice Core, Greenland, CO2Science again only focuses on the highest part of the MWP and ignores the rest. On average it was well below the CWP.
In the Great Bahama Bank, Straits of Florida, CO2Science once again moves the MWP to be earlier in time in order to highlight the highest point of the data. When you look at the actual MWP it turns out to be entirely lower than the CWP.
In the Iceberg Lake, Alaska, Co2Science accepts that the CWP was warmer than the MWP, however they also wish to point out that the last point in the graph, 1998 was lower than the highest point in the graph, 1970. Given that we know from modern thermometer readings that 1998 was quite a bit warmer than 1970, this reinforces the previous comment, that proxy records are very approximate estimates of LOCAL temperature, not hard definitive “to the second decimal place” records.
In “Lake 4, Southampton Island, Nunavut, Canada”, CO2Science move the MWP to be later in time. Again most of the actual MWP was colder than the CWP.
Oceans
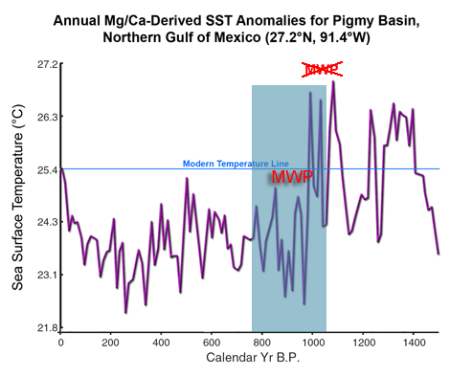
In Pigmy Basin Mg/Ca Proxy, Northern Gulf of Mexico, CO2Science move the MWP to be earlier in time in order to avoid the colder section of data.
In the Indo-Pacific Warm Pool, CO2Science make up their own “Current Temperature” in order to make the MWP appear warm. The data from which they draw this conclusion ends around 1850 AD, and if Co2Science’s conclusion were correct, that’d mean we’ve had no warming in the last 150 years, something modern thermometers disagree with. So too does the original paper.
In the Makassar Strait, CO2Science once again draw their own conclusions … “we calculate that the Medieval Warm Period was about 0.4°C warmer than the Current Warm Period”. The scientists working on the original paper disagree saying …
Reconstructed SST was, however, within error of modern values from about ad 1000 to ad 1250, towards the end of the Medieval Warm Period.
South America
In Nevado Illimani, Eastern Bolivian Andes, Bolivia , CO2Science did the best they could with unfavourable data. Unfortunately even moving the MWp period could not help their cause. The CWP is clearly warmer than any previous time.
Are we there yet?
The Current Warm Period (CWP) is the result of GHG emissions from years ago that linger and contribute to today’s warming.
Just as it takes many minutes for a kettle to boil once you switch on the kettle and apply energy, so too our planet takes a while to warm up after adding extra GHGs to the aatmosphere. CO2 is an especially long lived gas with the atmospheric effects remaining for hundreds if not thousands of years. We’ve flicked the switch and continue to increase the amount of energy retained in our system, however because the Earth is massive, it’s taking a while for the effects to become fully realised.
The concern is not about the current temperature occurring right now. The main concern is about the temperatures that we have already committed to, and through inaction, the even higher temperatures we are going to experience. We can’t turn off CO2 gases like we might turn off a kettle.
Climate denialsts comparing todays temperature against the MWP and forget to mention the 3 – 6 degrees (perhaps more) of warming we’ll encounter under a business as usual scenario.
Conclusion
- Climate scientists know that at some point in the history of this planet, it was warmer than today. whether the MWP was it or not remains to be seen.
- Whatever caused previous warmings (such as changes in solar, aerosols) is not causing the changes today. Scientists have understood for hundreds of years that CO2 is a greenhouse gas, and know the exact mechnism by which it traps heat.
- Climate scientists need to use proxy data from many locations in order to develop a global picture of temperature. It is not sufficient simply to point out some moments in some locations and then conclude that over the entire planet it was warmer.A
- A higher MWP is an arguement for climate higher sensitivity, meaning that our planet will see even greater warming as it responds to GHG forcings.
- CO2Science are either too stupid to realise their mistakes, or worse they are deliberately misleading their readers This video gives further insight into that question.
Tags: Medieval Warm Period








September 3, 2012 at 10:56 pm |
Terrific work!!!!! The first graphs really explain well the problem at the heart of CO2-“science”‘s method. They just can’t make up their mind where the MWP was.
September 4, 2012 at 8:42 am |
Thank you for showing the interest and skepticism that Jo fails to demonstrate.
September 5, 2012 at 9:53 pm |
It is amazing what a fuss deniers make about the Medieval Warm Period, Vikings in Greenland, wine exported from England … so what?
The Viking colony in Greenland was tiny, a couple of thousand souls, yet deniers talk as if they colonised the whole place, ice-cap and all!
As for wine from England, …. well, Scotland and Canada now have wine industries so what can you take from that?
Excellent post. These series of debunkings are very useful. Peter Hadfield’s video is also excellent.
September 9, 2012 at 10:30 pm |
Grape growing in England was a cultural proxy,not a climatic one.
The locals did not grow the grape vine. The Romans invaded and brought the vine with them…very keen of them given the climate!
I seem to remember reading that grape growing struggled on,with a handful of ‘winerys’ noted in the Domesday Book.
Now they grow the stuff in Scotland,and there are several hundred winerys…a proxy for affluence.
September 10, 2012 at 7:20 pm
I can’t find the reference right now, but IIRC the only clear absence of commercial viticulture in England was between WW I and II. A commercial vineyard was started in 1875 at Castell Coch (South Wales), and that was in production until 1920, despite chosing the wrong grape!
Weren’t we “just coming out of the Little Ice Age” at that time? 😉
September 6, 2012 at 10:29 am |
Indeed Toby. Here’s a link to grapes growing in Norway, of all places …
http://www.eventyrvin.no/english
If we use that old dumbarse-denier argument that says grape growing is a good proxy for temperatures then by rights it *must* be warmer now than during the MWP. I mean, even to my old eye’s Gvarv is well north of Scotland (on Google maps).
September 8, 2012 at 8:20 pm |
You just did what I have asked plenty of the pseudoskeptics to do whenever they brought up the CO2science-list.
Sometimes the fun is in the “BP” (generally that is 1950, ignoring at least half a degree of warming in many places), sometimes in the timing.
September 25, 2012 at 6:25 am |
1) Climate changes without human assistance. How can you tell the difference between climate change caused by human activity, versus climate change that would have happened anyway?
2) The one thing that there is no evidence for in any shape or form anywhere, is some sort of tipping point, where suddenly everything gets out of control and a catastrophic positive feedback loop. If it was warmer than currently in the past, and this planet didn’t turn into Venus, then we need some really good evidence why it should happen now.
And don’t bother mentioning computer models. Anyone who thinks that computer models by themselves are evidence for anything at all doesn’t understand anything at all really.
September 26, 2012 at 9:29 am |
1> How do you know it would have happened anyway? All known natural sources for climate change cannot explain the increase in heat and surface temperatures, whereas the known forcing of greenhouse gases can.
2> An exact tipping point you will never get – science cannot be that exacting. What there is evidence for is feedbacks such as when the Arctic ice melt allowing more heat to be absorbed. This is simple physics – no complex models required. Climate sensitivy studies suggest a range of possible temperatures increases per doubling of CO2. Gambling that it is hopefully low is not wise, nor is it good economic sense.
And why not mention computer models? Are you expecting climate scientists to use a slide rule instead? Nova often complains that the models don’t get it 100% accurate (no climate scientist ever expects them to be) and yet she never offers an alternative to what models provide. No model can explain the current period of warming without the inclusion of greenhouse gases. Perhaps your slide rule method can, but I would be very skeptical.
September 27, 2012 at 6:12 am |
Re. 2: it doesn’t need to become Venus-like to get humanity in trouble. The earth will survive no matter.
Also, there are some major differences with the past, such as the rate of release of greenhouse gases into the atmosphere as well as the fact that the sun has a higher output than in the ancient past (as in several hundreds of millions of years ago).
October 18, 2012 at 2:10 am |
Good presentation!
For some of the history on how this MWP meme came to be, see:
More use and mis-use of IPCC 1990 Fig 7.1(c). and We have to get rid of the MWP.
Note that money has flowed through the Heartland Institute to CO2Science,m and almost certainly to Jo Nova for The Skeptics Handbook. See Fake science, … and Fakeducation. Search for Nova in the PDFs.
October 20, 2012 at 12:49 pm |
nice work, you’ve done the work I was too lazy to do. This post will be a very useful thing to cite when people trot out the old “zillions of proxies show the MWP was warmer than present” claim.
just one thing. Could you remove the reference to “Evidence of unusual late 20th century warming from an Australasian temperature reconstruction spanning the last millennium”?
I believe the paper was under question (http://www.ncdc.noaa.gov/paleo/pubs/gergis2012/gergis2012.html)and it may have been withdrawn.
October 20, 2012 at 10:33 pm |
Thanks lolwot. I have updated the post and removed that paper. It will be interesting to see what impact there are to the updated version.
January 15, 2013 at 5:03 am |
More evidence that sinks Nova’s Warmer Period and reinforces our understanding of recent warming.
http://www.sciencedaily.com/releases/2013/01/130114152950.htm
“The amount of climate warming since the mid-20th century appears unprecedented in the millennium-long context.”
April 22, 2013 at 10:43 pm |
More research showing the MWP and LIA were not globally synchronized. 78 researchers colaborate and find evidence that also supports Mann’s hockeystick – a sad day for Nova.
http://www.nature.com/ngeo/journal/vaop/ncurrent/abs/ngeo1797.html
The last 2,000 years the planet had been slowly cooling, until the 19th century when we’ve gone and undone all of that with no sign of stopping.